Mr. Agnew Science Sept-Dec
| 8f31cb3818602b40459f6188b3fd3886.jpg |
| student_guidelines_2019__1_.pdf |
| rubric_2019__3_.pdf |
Welcome Back
January-March 2019
*Updates for this term:
We are happy to welcome Mrs. Stacie Reck, Ph.D. Assistant Professor of Education - Dept. Coordinator at Crandall University, as an intern to our science class staring January 7th. Mrs. Reck will be with us as an intern until April 26th.
We will be receiving a 3D printer that was awarded to our class through A STEM contest that was put on by the district. Our students showcased their awesome skills and it paid off!
STEM fair
The Science students of grade 6, 7, and 8 will be working away at the scientific method as a review for the upcoming STEM fair (Date to be announced)
Over the next few weeks we will be working on the following outcomes:
Outcomes and Indicators for grades Grade 6, Grade 7, and Grade 8 Science
GCO: Plan & Perform (PP) - Ask questions, make predictions about objects and events. Develop a plan for fair tests to investigate those questions. Conduct investigations about their environment. Work collaboratively to carry out science-related activities.
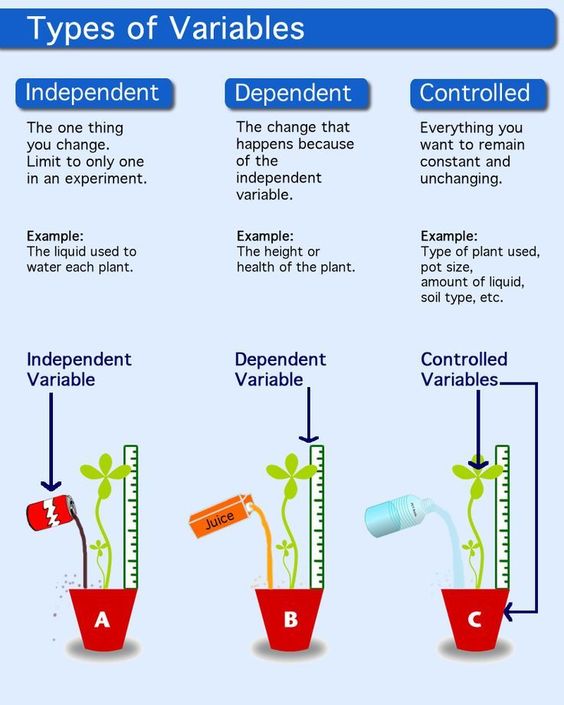
PP1 - Propose testable questions i. Write questions using language that suggests an investigation of two variables that are related. ii. Indicate specifically what will be tested and what will be measured. iii. Develop testable questions that indicate the independent variable (variable to test). iv. Develop testable questions that indicate the dependent variable (variable to be measured or observed). v. Use the terminology of independent, dependent.
PP2 - State a prediction and hypothesis i. Write prediction statements that are testable with variables that are specific enough to measure. ii. Write hypothesis statements using the “If, then, because” format, including a plausible reason (from previous learning and/or research); may use tentative words such as “evidence suggests” and “may”. iii. Write prediction and hypothesis statements in the third person. PP3 - Identify and describe variables i. Distinguish between what is being tested, what is being measured or observed and what is controlled. ii. Identify specific variables to measure that are related to the variable that is being tested. iii. Select one independent variable, create a list of possible dependent variables (and how to measure them), and a list of controlled variables.
PP4 - Plan investigations i. Identify appropriate equipment and materials for an investigation. ii. Explain how the investigation will be set up with one independent variable (to test), one dependent variable (to measure), and other major variables controlled. iii. Describe what will be measured or observed, and how and when it will be recorded. iv. Plan procedures to minimize experimental bias and ensure safety. v. Include multiple trials to increase accuracy, if appropriate. vi. Explain the procedure with enough detail that someone else will know how to do the investigation the same way.
PP5 - Conduct investigations i. Set up an investigation and follow the procedures as they are described. ii. Make observations and collect data that is relevant to the question being tested. iii. Collect and record qualitative data objectively (not influenced by prior knowledge). iv. Collect and record quantitative data accurately including units. v. Record data in an organized manner and label appropriately. vi. Follow safety procedures when using materials and equipment.
GCO: Analyze & Explain (AE) - Interpret findings from investigations using appropriate methods. Communicate ideas and results. AE1 - Classify, compile and display data i. Classify items or organisms according to characteristics that are the same or different using qualitative data. ii. Differentiate between discrete and continuous data using quantitative data. iii. Organize and display qualitative or quantitative data using the appropriate type of chart or graph (e.g., bar graph, double bar graph, line graph, pictograph chart, Venn diagram, Carroll diagram). iv. Use charts or diagrams: * Organize and display data clearly and accurately. * Label columns and rows (table, Carroll diagram) or areas (Venn diagram) accurately, and include a chart title. v. Use graphs: * Plot data accurately with independent variable on the x-axis, dependent variable on the y-axis, and the correct scale. * Title the graph, label the x- and y-axis including units, and include a legend where appropriate.
AE2 - Analyze data patterns i. Identify and explain in detail patterns, trend or relationships. ii. Recognize that with multiple trials, the data will be averaged for each trial. iii. Identify a discrepancy in data (outliers). iv. Explain possible sources of error in methods or equipment.
AE3 - Draw conclusions i. State a logical conclusion that answers the initial question. ii. Indicate whether the data supports, refutes or is inconclusive about the initial prediction. iii. Justify the conclusion by providing evidence from data collected. iv. Compare the results of an investigation to those of others and explain why results may vary. v. Discuss fairness of experimental design and suggest improvements for a follow-up investigation. vi. Design, adjust and evaluate a device or system.
AE4 - Apply learning i. Extend what has been learned to develop new questions and address new problems. ii. Apply what has been learned to situations beyond the classroom. iii. Do research and evaluate the sources of information for relevancy and reliability. iv. Evaluate results in relation to other scientific investigations and knowledge.
| |||||||
|
|
| ||||
 RSS Feed
